18 February 2011

Atlas of the Biosphere

This amazing FREE GIS data portal is hosted by the University of Wisconsin - Madison. The objective of this site is to gather and deliver as much information about the environment as possible. The Data and Maps sections contain “ready-to-download” geographically explicit data broken down into four general categories: Humans, Land Use, Ecosystems, and Water Resources. The Schematics section looks at the various resource flows and pools that make up individual Earth systems.

Mapping the Biosphere
In this section of the website you will find maps of environmental variables. Feel free to download anything and everything. If you use anything from the Atlas in a publication, please credit the Center for Sustainability and the Global Environment (SAGE) at the University of Wisconsin-Madison.


Data available under following categories for FREE DOWNLOAD (in GIS ESRI ArcView Format)
  • Human Impacts (Population, Life Expectancy, Literacy Rates, Built-Up Land, Infant Mortality Rate, Per Capita Oil Usage, Population (1995), Population Density (1995), Population Doubling Time, Population Growth Rate and Population Under Age 15
  • Land Use (Croplands, Pastures, Urban Lands, Irrigated Lands, Soil Organic Carbon, Soil pH and Suitability for Agriculture)
  • Ecosystems (Annual Total Precipitation, Average Annual Relative Humidity, Average Annual Temperature, Average Temperature (DJF), Average Temperature (JJA), Average Temperature (MAM), Average Temperature (SON), Evapotranspiration, Growing Degree Days, Lakes and Wetlands, Net Primary Productivity, Potential Evapotranspiration, Potential Vegetation, Soil Moisture, Soil Organic Carbon, Soil pH and Topography)
  • Water Resources (Annual Runoff, Annual Total Precipitation, Lakes and Wetlands, Potential Evapotranspiration, Irrigated Lands, Lakes and Wetlands, Snow Depth and Soil Moisture)
Below, a sample preview image of one of the available datasets:

The Earth System Schematics
Detailed information available under following topics;

  • Carbon Cycle
  • IBIS
  • Nitrogen Cycle
  • Ozone in the Atmosphere
  • Radiation Budget
  • The Rock Cycle
  • Water Cycle

Click here to access Biosphere Data Download Page

HYDRO 1k Elevation FREE GLOBAL Datasets

HYDRO1k provides a suite of “FREE” geo-referenced data sets, both raster and vector, which will be of value for all users who need to organize, evaluate, or process hydrologic information on a continental scale.

HYDRO1k is a geographic database developed to provide comprehensive and consistent global coverage of topographically derived data sets, including streams, drainage basins and ancillary layers derived from the USGS’ 30 arc-second digital elevation model of the world.

The HYDRO1k data sets are being developed on a continent by continent basis, for all landmasses of the globe with the exception of Antarctica and Greenland. The HYDRO1k package provides, for each continent, a suite of six raster and two vector data sets. These data sets cover many of the common derivative products used in hydrologic analysis. The raster data sets are the hydrologically correct DEM, derived flow directions, flow accumulations, slope, aspect, and a compound topographic (wetness) index. The derived streamlines and basins are distributed as vector data sets.


Datasets are available for Free direct downloads as:
  • Africa
  • Asia
  • Australasia
  • Europe
  • North America
  • South America
And Categorized as:
  • Aspect
  • Compound
  • Topographic Index
  • Drainage Basins
  • Elevation Data
  • Flow Accumulation
  • Flow Direction
  • Slope
  • Streams
Below; A Typical Sample Data Download page:
This work was conducted by the U.S. Geological Survey in cooperation with UNEP/GRID Sioux Falls. Additional funding was provided by the Brazilian Water Resources Secretariat and the Food and Agriculture Organization/Inland Water Resources and Aquaculture Service.

Public Data Sets on Amazon Web Services

Public Data Sets on AWS provides a centralized repository of public data sets that can be seamlessly integrated into AWS cloud-based applications. AWS is hosting the public data sets at no charge for the community, and like all AWS services, users pay only for the compute and storage they use for their own applications.

Previously, large data sets such as the mapping of the Human Genome and the US Census data required hours or days to locate, download, customize, and analyze. Now, anyone can access these data sets from their Amazon Elastic Compute Cloud (Amazon EC2) instances and start computing on the data within minutes. Users can also leverage the entire AWS ecosystem and easily collaborate with other AWS users. For example, users can produce or use prebuilt server images with tools and applications to analyze the data sets. Users can also discuss best practices and solutions in the dedicated Public Data Sets forum.

By hosting this important and useful data with cost-efficient services such as Amazon EC2, AWS hopes to provide researchers across a variety of disciplines and industries with tools to enable more innovation, more quickly.

Available Public Data Sets on AWS
AWS will continue to add to the available collection of public domain and non-proprietary data sets over time. The data sets currently available are shown below. The Linux/UNIX snapshots are in ISO9660 or EXT3 format and the Windows snapshots are in NTFS format.


Here are some examples of popular Public Data Sets:
  • Annotated Human Genome Data provided by ENSEMBL
    The Ensembl project produces genome databases for human as well as almost 50 other species, and makes this information freely available.
  • Various US Census Databases from The US Census Bureau
    United States demographic data from the 1980, 1990, and 2000 US Censuses, summary information about Business and Industry, and 2003-2006 Economic Household Profile Data.
  • UniGene provided by the National Center for Biotechnology Information
    A set of transcript sequences of well-characterized genes and hundreds of thousands of expressed sequence tags (EST) that provide an organized view of the transcriptome.
  • Freebase Data Dump from Freebase.com
    A data dump of all the current facts and assertions in the Freebase system. Freebase is an open database of the world’s information, covering millions of topics in hundreds of categories. Drawing from large open data sets like Wikipedia, MusicBrainz, and the SEC archives, it contains structured information on many popular topics, including movies, music, people and locations – all reconciled and freely available.

Below, the screen-shot of AWS Public Data Sets resource center

Global 30 Arc-second Elevation Data : GTOPO30

GTOPO30 is a global raster Digital Elevation Model (DEM) with a horizontal grid spacing of 30 arc seconds (approx. 1-km); the most popular, publicly available and complete global DEM dataset. And allows users to FREELY preview or DOWNLOAD Data.

GTOPO30 was derived from several raster and vector sources of topographic information. For easier distribution, GTOPO30 has been divided into tiles which can be selected from the map shown above. Detailed information on the characteristics of GTOPO30 including the data distribution format, the data sources, production methods, accuracy, and hints for users, is found in the GTOPO30 README link, at the end of this article.


Below, the GTOPO30 “easy-to-use” Data Download page:

GTOPO30, completed in late 1996, was developed over a three year period through a collaborative effort led by staff at the U.S. Geological Survey's Center for Earth Resources Observation and Science (EROS). The following organizations participated by contributing funding or source data: the National Aeronautics and Space Administration (NASA), the United Nations Environment Programme/Global Resource Information Database (UNEP/GRID), the U.S. Agency for International Development (USAID), the Instituto Nacional de Estadistica Geografica e Informatica (INEGI) of Mexico, the Geographical Survey Institute (GSI) of Japan, Manaaki Whenua Landcare Research of New Zealand, and the Scientific Committee on Antarctic Research (SCAR).

GeoNetwork portal for FREE spatial data

GeoNetwork opensource allows to easily download and share geographically referenced thematic information from hundreds of different organizations from around the world and find Interactive Maps, GIS datasets, Satellite Imagery and Related Applications. Its online database holds more than 450 different variables. Display them on-the-fly as maps, graphs, data tables or download the data freely in different formats.

Main Features are :
  • Instant search on local (FAO & UN) and distributed geospatial catalogues
  • Uploading and downloading of data, documents, PDF's and any other content
  • An interactive Web map viewer that combines Web Map Services from distributed servers around the world
  • Online map layout generation and export in PDF format
  • Online editing of metadata with a powerful template system
  • Scheduled harvesting and synchronization of metadata between distributed catalogues
  • Groups and users management
  • Fine grained access control
Search catalogue by topic:
  • Administrative and Political Boundaries
  • Agriculture
  • Applied Ecology
  • Biological and Ecological Resources
  • Climate
  • Fisheries and Aquaculture
  • Forestry
  • Hydrology and Water Resources
  • Land Cover and Land Use
  • Population and Socio-Economic Indicators
  • Soils and Soil Resources
  • Topography
GeoNetwork opensource is a standard based and decentralized spatial information management system, designed to enable access to geo-referenced databases and cartographic products from a variety of data providers through descriptive metadata, enhancing the spatial information exchange and sharing between organizations and their audience, using the capacities and the power of the Internet. The system provides a broad community of users with easy and timely access to available spatial data and thematic maps from multidisciplinary sources, that may in the end support informed decision making. The main goal of the portal is to increase collaboration within and between organizations for reducing duplication and enhancing information consistency and quality and to improve the accessibility of a wide variety of geographic information along with the associated information, organized and documented in a standard and consistent way.
Below, the detailed search interface which helps users to find exactly what they want !
GeoNetwork's purpose is:
  • To improve access to and integrated use of spatial data and information
  • To support decision making
  • To promote multidisciplinary approaches to sustainable development
  • To enhance understanding of the benefits of geographic information

Global Map and Data from Intl. Steering Committee

The primary purpose of this Committee is to examine measures that concerned national, regional and international organizations can take to foster the development of Global Mapping in order to facilitate the implementation of global agreements and conventions for environmental protection as well as the mitigation of natural disasters and to encourage economic growth within the context of sustainable development.

Global Map is a group of global geographic data sets of known and verified quality, with consistent specifications which is open to the public as FREE downloads. Global Map is considered a common asset of mankind, and will be distributed worldwide.

The ISCGM Global Mapping Project supports development of global scale geographic information through international cooperation. Registration is required before data downloading. Global map thematic data sets will provide coverage of the whole land area on earth at 1 km resolution in a consistent manner. Each thematic data set is released to the public in a digital format for easy handling by computer and its content is equivalent to conventional maps at scales of 1 : 1,000,000.
Below map shows the progress & participants of the project.
Summary of the Global Map DataThe Global Map Data have 8 thematic layers. They are Boundaries, Transportation, Drainage, Population Centers, Elevation, Vegetation, Land use and Land cover. These layers were produced in either vector or raster data. The layers in vector representation are Boundaries, Transportation, Drainage and Population Centers. The layers in raster representation are Elevation, Vegetation, Land use and Land cover. Vector data and raster data will be downloaded separately. And, raster data can be downloaded separately by every layer.

Sample Map: This map was produced using elevation data and representing the image in 3D

The data source of Land use, Land cover and Vegetation layers is Global Land Cover Characterization datasets by the U.S. Geological Survey’s (USGS) Earth Resources Observation System (EROS) Data Center, the University of Nebraska-Lincoln (UNL) and the Joint Research Center of the European Commission. The source of Elevation layers is GTOPO30 by U.S. Geological Survey’s EROS Data Center.
(Free Registration Required)Click here to access the FAQ

Global Evapo-Transpiration and Aridity Index Data

The Global Potential Evapo-Transpiration (Global-PET) and Global Aridity Index (Global-Aridity) datasets provide FREE high-resolution global raster climate data related to evapo-transpiration processes and rainfall deficit for potential vegetative growth.

These datasets are based on modeling and analyses by Antonio Trabucco (currently at the Forest, Ecology and Management Research Group, K.U. Leuven), with the support of the International Water Management Institute (IWMI) and the International Centre for Integrated Mountain Development (ICIMOD), and are provided online by the CGIAR-CSI Consortium for Spatial Information with the support of the International Center for Tropical Agriculture (CIAT).

The Global-PET and Global-Aridity datasets are provided for non-commercial use in standard ARC/INFO Grid format, at 30 arc seconds (~ 1km at equator), to support studies contributing to sustainable development, biodiversity and environmental conservation, poverty alleviation, and adaption to climate change globally, and in particular in developing countries. The methods used to derive these datasets, and the data dictionary, are described briefly below.

FREE DATA DOWNLOAD:The Global-PET dataset consists of the following data layers (Available for download by clicking on links below):
  • Monthly Mean PET (monthly averages over the period 1950-200) (12 data layers, i.e for each month)

  • Mean Annual PET (annual average over the period 1950-2000) (1 data layer)

  • The Global-Aridity data layer: Mean Annual Aridity (annual average over the period of 1950-2000) (1 data layer)
Methods, Dataset Description, and Non-Commercial Use Policy:Users should read the Methodology and Dataset Description to understand and appropriately apply the Global-Aridity and Global-PET datasets, and to be aware of the Non-Commercial Use Policy. The authors of the Global-Aridity and Global-PET datasets recommend that all users who intend to apply these datasets to assess more regional and local condtions should consider the issues of scale, resolution and degree of interpolation of the original data.

The data set may be freely used for non-commercial scientific and educational purposes, provided it is described as the CGIAR-CSI Global-Aridity and Global-PET Geospatial Database.

World Digital Library !

The World Digital Library (WDL) makes available on the Internet, free of charge and in multilingual format, significant primary materials from countries and cultures around the world from 8000 BC to 2009 AD and DOWNLOAD them in TIF and other known formats !

Type of Data/Materials Available
  • Maps
  • Prints, Photographs
  • Books
  • Manuscripts
  • Motion Pictures
  • Sound Recordings

The principal objectives of the WDL are to:

  • Promote international and intercultural understanding;
  • Expand the volume and variety of cultural content on the Internet;
  • Provide resources for educators, scholars, and general audiences;
  • Build capacity in partner institutions to narrow the digital divide within and between countries.

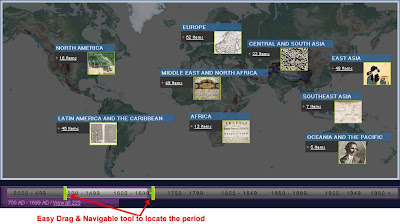
Easy Drag & Navigable tool to locate the period, identify/select data and download
Topics
History & geography, Earth sciences & geology, Geography & travel, Geology, hydrology & meteorology, Landscape architecture, Historical, geographic & persons treatment, History of Europe, North America, Asia, Middle East & North Africa, Latin America & Caribbean, Africa, Oceania & Pacific, Atlases, maps, charts & plans, Social sciences, Arts & recreation, Religion, Technology, Social groups, Science, Other religions, Social problems & social services, Customs, etiquette & folklore, Agriculture, Architecture, Language, Christianity & Christian theology, Political science, Public administration & military science, Other languages, Plants (Botany), Medicine & health, Landscaping & area planning, Painting, Photography & computer art, Sports, games & entertainment, History of Europe, History of Africa, Creeds & catechisms, Religions of Indic origin, Islam, Babism & Bahai Faith, International relations, General considerations of public administration, Social welfare problems & services, Other social problems & services and many more !

The WDL makes it possible to discover, study, and enjoy cultural treasures from around the world on one site, in a variety of ways. These cultural treasures include, but are not limited to, manuscripts, maps, rare books, musical scores, recordings, films, prints, photographs, and architectural drawings.

Items on the WDL may easily be browsed by place, time, topic, type of item, and contributing institution, or can be located by an open-ended search, in several languages. Special features include interactive geographic clusters, a timeline, advanced image-viewing and interpretive capabilities. Item-level descriptions and interviews with curators about featured items provide additional information.

Navigation tools and content descriptions are provided in Arabic, Chinese, English, French, Portuguese, Russian, and Spanish. Many more languages are represented in the actual books, manuscripts, maps, photographs, and other primary materials, which are provided in their original languages.

The WDL was developed by a team at the U.S. Library of Congress, with contributions by partner institutions in many countries; the support of the United Nations Education, Scientific, and Cultural Organization (UNESCO); and the financial support of a number of companies and private foundations.

Click here to ACCESS The World Digital Library !
OR
Click here to ACCESS The Details and FAQ

World Spatial Database on Protected Areas !

The World Database on Protected Areas (WDPA) is the most comprehensive global spatial dataset on marine and terrestrial protected areas available.

Protected areas are internationally recognised as major tools in conserving species and ecosystems. Up to date information on protected areas is essential to enable a wide range of conservation and development activities.

Since 1981 UNEP-WCMC, through its Protected Areas Programme, has been compiling this information and making it available to the global community. The WDPA is a joint project of UNEP and IUCN, produced by UNEP-WCMC and the IUCN World Commission on Protected Areas working with governments and collaborating NGOs.

The World Database on Protected Areas is a foundation dataset for conservation decision making. It contains crucial information from national governments, non-governmental organizations, academic institutions, international biodiversity convention secretariats and many others. It is used for ecological gap analysis, environmental impact analysis and is increasingly used for private sector decision-making.

Search and Download your Protected Area (FREE)
By registering as a User, you will be able to FREELY download the protected areas selected by using the advanced search tool on the WDPA website. These protected area downloads will be provided in GIS (shapefile) and KML formats.


Currently, downloads using the Search Tools are limited to a country level so if you require a global or multi-country dataset please use the 2009 WDPA Annual Release.

Below is an outline of the stages involved when downloading data using the World Database on Protected Areas Search Tools:

STAGE 1- Register as a WDPA User and Login (It's FREE !)

STAGE 2- Search for the Protected Areas you require, or that meet chosen criteria with our advanced search

STAGE 3- Once you have your results from the search you may then, after agreeing to our terms and conditions, download the data

STAGE 4- Your chosen downloads from these searches will be available under the Download tab whenever you login

Click here to access the advanced search tool for MAP DOWNLOADS !

Click here if you require a global or multi-country datasets

Click here to EXPLORE the GLOBAL PROTECTED AREAS Interactive Map

The Global Health Atlas

In a single electronic platform, the World Health Organization’s (WHO) Communicable Disease Global Atlas is bringing together for analysis and comparison standardized data and statistics for infectious diseases at country, regional, and global levels. The analysis and interpretation of data are further supported through information on demography, socioeconomic conditions, and environmental factors. In so doing, the Atlas specifically acknowledges the broad range of determinants that influence patterns of infectious disease transmission.

Over the next year, the system aims to provide a single point of access to data, reports and documents on the major diseases of poverty including malaria, HIV/AIDS, tuberculosis, the diseases on their way towards eradication and elimination (such as guinea worm, leprosy, lymphatic filariasis) and epidemic prone and emerging infections for example meningitis, cholera, yellow fever and anti-infective drug resistance.

The database will be updated on an ongoing basis and in addition to epidemiological information, the system aims to provide information on essential support services such as the network of communicable diseases collaborating centres, the activities of the Global Outbreak Alert and Response Network among others.


How to use the Global Health Atlas :

Data Query
This allows users to browse, view, query, search the contents of the WHO’s Communicable Disease global database and output data in reports, charts and maps.

Categories :
  • Communicable Diseases
  • Human Resources for Health
  • Noncommunicable Diseases
  • World Health Statistics

Topic :

  • CholeraHIV/AIDS/STIsInfluenza
  • Malaria
  • Polio (as of 11 May 2005)
  • RabiesTuberculosis (as of 24 March 2009)
  • Yellow Fever (last updated 21 July 2005)

And, HUNDREDS of Sub-Topics !

Interactive Mapping
This provides a user-friendly mapping interface that allows users to select geographic areas of interest and create maps of diseases, the location of health facilities, schools, roads, geographic features.


Maps and Resources
This provides access to the public domain to static maps and related documents, publications and statistics on infectious diseases.

Click here to ACCESS the MAPS & RESOURCES !


Click here to ACCESS the DATA QUERY !


Click here to ACCESS the INTERACTIVE MAPPING !

GLOBAL Mineral Resources On-Line Spatial Data

A source for regional and global Geology, Geochemistry, Geophysics, and Mineral Resource maps and data! – Here you will find information and free data about Mineral Resources, Geochemistry, Geology and Geophysics.

Downloadable Data
Downloadable Data on Mineral Resources and related geosciences. National and global data sets available through similar web interfaces. Choose a geographic area of interest, select the file format you need, and download.

Web Services
Map services provided using Open Geospatial Consortium (OGC) specifications

Purpose of this site
The Mineral Resources Program (MRP) of the U.S. Geological Survey maintains an Internet web site to provide public access to various forms of digital data. Digital data sets include geology, geochemistry, geophysics, mineral resources, base maps, and other data. Coverage varies from regional to global. We present these data in an interactive map-based format that allows the user to create individualized maps by selecting data sets and map areas.

The MRP invites participation from other federal, state, and local governmental agencies in supplying data to this web site. Because there have been questions in the past concerning ownership and publication rights to digital data sets, the MRP issues this policy statement, which covers all data presented on this web site.

What users gets:
  • Display all data sets on screen at scales that are appropriate to the data set.
  • Overlay data sets in any combination.
  • Print simplified explanations (symbols and short descriptions) for all data sets.
  • Print small-scale (page-sized) renditions of maps containing any combination of data sets.
  • Download plot files to plot maps containing any combination of data sets at user-specified scales.
  • Query all data sets.
  • Download portions of data sets that are freely available to the public.

Future Enhancements
The development and enhancement of the SIDP ArcIMS client is active and ongoing. Currently, the client, which is written primarily in JavaScript, is undergoing additional customization to provide added functionality. In the future additional spatial data sets will be included as they become available.


Click here to ACCESS the site !

MODIS Reprojection Tool Web Interface

MODIS Reprojection Tool Web Interface MRTWeb 2.0 combines familiar capabilities of the USGS Global Visualization Viewer (GloVis) and the downloadable MODIS Reprojection Tool (MRT). The MRTWeb interface organizes GloVis and MRT funtionality into three main tabs: Selection, Process, and Download. Submitted jobs are run with MRT 4.0 processing software across multiple servers at the LP DAAC. Output data sets are staged on a job-specific ftp directory for user download.

Data Pool
The Data Pool is the publicly available portion of the LP DAAC online holdings. Data Pool provides a more direct way to access files by foregoing their retrieval from the nearline tape storage devices. All Data Pool holdings are available at no cost to the user.

MODIS Data Pool Holdings
MODIS Composites are mostly online and will be completely online in the near future. Many of the MODIS dailies are online and will be completely populated during the longer term.

ASTER Data Pool Holdings
The most recent two years of ASTER Level-1B products for the U.S. and territories is available for Data Pool access.

Download via FTP
This Data Pool access method allows users to navigate directly to the product collection of interest and then to the product period(s) of interest within the online file structure. Then, the HDF-EOS files, XML metadata files, and JPG browse images (if available) may simply be downloaded by FTP.

Direct Search Interface
This Data Pool access method allows users to select a collection interest, then define spatial and temporal filters to return a listing of data sets meeting their criteria. Data files returned from this search are exposed to limited on-the-fly reformatting, reprojection, and subsetting services.
OR

GLOBAL Gridded Population Maps and Data

Gridded Population of the World, version 3 (GPWv3) is the third edition of a FREE large-scale data product that demonstrates the spatial distribution of human population across the globe. This includes a major update to the underlying population and spatial data, and in its wake, additional updates have been made, for example, to the Africa accessibility model. Similarly, in collaboration with the Food and Agriculture Organization of the United Nations (FAO), CIESIN and CIAT have constructed a gridded population projection to 2015.

Gridded Population of the World, version 3 (GPWv3) and the Global Rural-Urban Mapping Project (GRUMP) are the latest developments in the rendering of human populations in a common geo-referenced framework, produced by the Center for International Earth Science Information Network (CIESIN) of the Earth Institute at Columbia University.

The Maps & Data download page:GPWv3 depicts the distribution of human population across the globe. It is the most detailed version of GPW to date with more than three times the amount of data as version 2, and includes population estimates to 2015. GRUMP builds on GPWv3 by incorporating urban and rural information, allowing new insights into urban population distribution and the global extents of human settlements.

A Sample Map:

Developed between 2003 and 2005, GPWv3 and GRUMP provide globally consistent and spatially explicit human population information and data for use in research, policy making, and communications. GRUMP is currently in its alpha edition. Check back in early 2006 for updates. For more information, please see the projects’ Description and History. We appreciate user feedback, including copies of published papers and maps that use our data; please review the data usage policy. For a list of the many individuals who contributed time, effort, and expertise to these data products.

Available data products for free download:

  • Summaries of population and spatial data
  • Downloadable by country, continent, globe and data type
  • ANCILLARY figures and maps, illustrating how these data products are being utilized

Access Global population data & maps download page !
OR
Read more about GLOBAL Gridded Population Maps and Data

European GLOBAL Digital Archive on Soil Maps

For some 40 years, ISRIC – World Soil Information has been providing significant support to the international science community by collecting and archiving regional, national and global-scale maps of soils and land resources.

Realizing the need to conserve the information on existing maps, which underpin the fast-developing thematic mapping strategies to support soil protection, the Institute of Environment and Sustainability (IES) in the European Commission and ISRIC came up with this project and the immediate objective is to transfer soil information into digital format, with the maximum resolution possible, to preserve the information of paper maps that are vulnerable to deterioration.

Beyond data rescue, the archive is expected to develop into a common platform for storing soil maps from around the world and making the information readily accessible. Organizations that maintain soil map archives in paper form, and wishing to conserve this information by transferring it into digital form, are invited to join the EuDASM program.

A Sample Soil map of Europe:

A Sample Soil map of Asia:

The initiative for this program was taken by Dr Luca Montanarella of the European Joint Research Centre and Dr Otto Spaargaren of ISRIC – World Soil Information in October 2004. The first level success for this initiative was figured out by completion of the around 2000 soil maps pertaining to the African continent. Through this digitization program the map quality and precision of information were preserved against further loss assuming to be required for future use by land resources specialists.

All the maps are categorized, and can be downloaded as below:
  • Africa
  • Asia
  • Canada
  • Caribbean islands
  • Europe
  • Latin America
  • United States of America

Click here to Access to Soil Maps

OR

Click here for complete details & see the Extent of coverage

Global GEO Data Portal (FREE geospatial & statistical data)

The GEO Data Portal offers you FULLY FREE, fast and easy access to a wide range of statistical and geospatial data sets. The GEO Data Portal is the authoritative source for data sets used by UNEP and its partners in the Global Environment Outlook (GEO) report and other integrated environment assessments.

Its online database holds more than 450 different variables, as national, sub-regional, regional and global statistics or as geospatial data sets (maps), covering themes like Freshwater, Population, Forests, Emissions, Climate, Disasters, Health and GDP. Display them on-the-fly as maps, graphs, data tables or download the data in different formats.

New data sets added/updated:
Participation in Treaties - Basel Convention, Participation in Treaties - Convention on Biological Diversity, Participation in Treaties - Convention on International Trade in Endangered Species of Wild Fauna and Flora, Participation in Treaties - Convention on the Conservation of Migratory Species of Wild Animals, Participation in Treaties - Kyoto Protocol, Participation in Treaties - Ramsar Convention on Wetlands, Participation in Treaties - Rotterdam Convention, Participation in Treaties - Stockholm Convention on Persistant Organic Pollutants, Participation in Treaties - United Nations Convention on the Law of the Sea, Participation in Treaties - United Nations Convention to Combat Desertification, Participation in Treaties - United Nations Framework Convention on Climate, Change (National Reports, UNFCCC), Participation in Treaties - Vienna Convention and Montreal Protocol, Participation in Treaties - World Heritage Convention

Emissions of CH4, (National Reports, UNFCCC), Excluding Land Use, Land-Use Change and Forestry, Emissions of CH4, (National Reports, UNFCCC), Including Land Use, Land-Use Change and Forestry, Emissions of CO - Total (National Reports, UNFCCC), Emissions of CO2, (National Reports, UNFCCC), Excluding Land Use, Land-Use Change and Forestry, Emissions of CO2, (National Reports, UNFCCC), Including Land Use, Land-Use Change and Forestry, Emissions of HFCs, PFCs and SF6 - Aggregated (National Reports, UNFCCC), Emissions of NMVOC - Total (National Reports, UNFCCC), Emissions of NO2 (National Reports, UNFCCC), Excluding Land Use, Land-Use Change and Forestry, Emissions of NO2 (National Reports, UNFCCC), Including Land Use, Land-Use Change and Forestry, Emissions of NOX - Total (National Reports, UNFCCC), Emissions of SO2 - Total (National Reports, UNFCCC)

Click here to ACCESS The Global GEO Data Portal

AND

Click HERE to ACCESS the tutorials and User’s guide

FREE Live Training Seminars from ESRI !

GIS training by a technical expert streamed directly to your desktop. Live Training Seminars are live, interactive, and free. These LIVE Training Seminars are designed for those who want GIS training on a focused topic presented live by an ESRI technical expert.

Live Training Seminars run approximately 60 minutes and are broadcast live from ESRI in Redlands, California. The seminars are free and there is no registration—attendance is on a first-come, first-served basis.

Live Training Seminars are FREE and feature:
Preparation for the seminar
Follow these instructions to verify that you have all of the required software and a valid login to view the seminar. The seminar uses both Windows Media Player and Flash.

In the right column, click "test the sample presentation" and login with your ESRI Global account. If you don't have an account, click the "Create New Account" link. You will need an account to view the Live Training Seminar.

The test presentation window will open. Follow the instructions in the left-hand panel. In a few seconds you should start seeing slides and hearing music. If the test is not successful, check the FAQs for troubleshooting tips.

Attending the seminar
On the day of the seminar, go to Live Training Seminars, click the "Attend Seminar" button, and log into your ESRI Global account. If you do not have one, create an account for you.

Once the presentation window opens, you should see a slide showing the time the seminar starts and hear music. If you don't, click the refresh link in the upper-right corner or click the Technical Help link in the upper-left hand corner for technical support.

Recorded Live Training Seminars
Live Training Seminars are recorded, then made available as either a Training Seminar or a Web Course a few weeks after the live presentation.

Training Seminars are FREE. Web Courses include the recording plus an exercise, exam, and certificate of completion and may have a nominal cost.

FREE Global GIS Landsat images from USGS

The USGS now offers all users the entire Landsat 1-5 and 7 archive data at no charge using a standard data product recipe. "The opening of the Landsat archive to free, web-based access is like giving a library card for the world's best library of Earth conditions to everyone in the world."

Direct Data Access : Use one of the following methods to browse and request Landsat satellite data:

EarthExplorer : provides access to satellite, aerial photographic, and mapping cartographic data products. http://edcsns17.cr.usgs.gov/EarthExplorer/

Below the screen grab of Earth Explorer’s easy-to-use data download interface:


GloVis : The U.S. Geological Survey (USGS) Global Visualization Viewer (GloVis) is a browse-based tool for selected satellite and aerial data products. http://glovis.usgs.gov/

Landsat International Ground Stations (IGS) Network : Landsat satellites have collected scenes for locations outside the U.S. that are not archived or distributed by the USGS Earth Resources Observation and Science (EROS) Center. These scenes must be ordered directly from the Ground Stations that acquired the data. Data prices, formats, and/or processing options may vary according to the data provider.

Below, the maps show the locations of ground stations operated by USGS International Cooperators (ICs) for the direct downlink and distribution of Landsat 7 (L7) and/or Landsat 5 (L5) image data. The red circles show the approximate area over which each station has the capability for direct reception of Landsat data. The green circles show the components of the U.S. Geological Survey (USGS) ground station network, while the dashed circles show stations with dual status.


For data product details and more information on Landsat satellite data, see Product Information.

Opening the USGS Landsat Archive to the world!
The Electronic access to the entire USGS Landsat 7 archive, enabling users to download standard-format scenes at no charge, has been an amazing success, with over 225,000 scenes downloaded since October 1st. Previously acquired imagery from Landsat 1 through Landsat 5, is also now available for download at no charge using the same standard processing format. Processing parameters and other details about the products can be found at
http://landsat.usgs.gov/products_data_at_no_charge.php.

Newly acquired Landsat 7 ETM+ SLC-off and Landsat 5 TM images with less than 40 percent cloud cover are automatically processed and made available for immediate download. Imagery with greater than 40 percent cloud cover can be processed upon request. Once the requested scenes are processed, an email notification is sent to the customer with instructions for downloading. These scenes will then become accessible to all users. Landsat data can be searched, downloaded, or requested from GloVis or EarthExplorer. High demand for this data may result in slow search performance and processing times, which typically range from 1-3 days for Landsat 7 ETM+ and some Landsat 5 TM data and 3-4 weeks for Landsat 1-5 MSS, Landsat 4 TM and some Landsat 5 TM data.

Free GIS and Remote Sensing data on Global scales

Award Winning, IWMI Data Storehouse Pathway (IWMI-DSP) provides more than 10 terabytes of high scientific quality remote sensing and GIS data that are FREELY available through its globally known portal. The site has more than 6,000 registered users from more than 90 countries, who downloads data absolutely FREE !

Large volumes of data are also available at Global, Regional, National and River Basins levels, which includes More than 30 River Basin data from all over the world! These data are catalogued, streamlined and released to the public FREELY through an excellent easy-to-download web interface. Much of the river basin and other datasets are composed as single mega files of hundreds or sometimes thousands of bands consisting of continuous streams of 8-day or monthly time series data in several wavebands and/or indices.

The Remote Sensing and Geographic Information System Unit (RS GIS Unit) of the International Water Management Institute (IWMI), is a centralized facility for all spatial data related activities of IWMI at the headquarters in Sri Lanka and Regional Offices located in different parts of the world.

Large volumes of multi-temporal data from multiple satellite sensors are used in several IWMI research projects. These projects include: (a) Global Irrigated Area Mapping (GIAM) at global to local scales, (b) the Wetland project in the Limpopo river basin of four Southern African Nations, (c) the Krishna river basin project in India, (d) the Indo-Gangetic river basin project in India and Pakistan, (e) the Drought Assessment and Mitigation project in Afghanistan, Pakistan, and parts of India, and (f) the bio-diversity project in Sri Lanka.

Comprehensive river basin datasets are available for a number of benchmark basins spread across the World such as Limpopo (South Africa), Ruhuna (Sri Lanka), Krishna (India), and Ganges-Indus (India and Pakistan) and many more. Most innovative datasets are in the data archive named: (a) AVHRR 0.1 degree monthly data as a single mega file of 956 bands over 20 years (red, near-infrared, 2 thermal infrared bends), (b) MODIS continuous streams of data from 2000 to present every 8-days for several benchmark river basins mentioned above, (c) SRTM 90-m DEM data for Asia, (d) rainfall data available monthly for last 40-years at 0.5 degree resolution for the entire globe, and (e) Satellite sensor data from sensors such as SPOT vegetation, Landsat ETM+, TM, MSS, and a few IKONOS images for various spots in the World. …some glimpses of other available datasets although those are not derived.

This portal received the “Special Achievement in GIS” award at ESRI’s 27th Annual User Conference. This award is being given to user sites around the world in recognition of their outstanding work in the GIS field. This portal was selected to receive this prize from over 100,000 sites worldwide.

Interactive metadata based search engine allows users to search precisely what they want and know the data before they start downloading. Below a screen-grab of a search result:

Below a screen-grab of a hassle-free “one click” data download interface:

Okay, why are you waiting for… just Go grab your piece of data !
http://www.iwmidsp.org/

USGS Global Seamless Map Server

Access and download Interactive Maps from USGS Global Seamless Map Server. This enables a user to view and FREE download many geospatial data layers, such as National Elevation Dataset, National Land Cover Dataset, High Resolution Orthoimagery, and many more.

An approach is to provide free downloads of national base layers, as well as other geospatial data layers. These layers are divided into framework categories.
  • Places
  • Structures
  • Transportation
  • Boundaries
  • Hydrography
  • Orthoimagery
  • Land Cover
  • Elevation

Click here to access USGS Global Seamless Map Server

Information about The USGS Global Seamless Map Server, Product Information, FAQ's, and homepage Links are accessible through the home page. Each page contains a HELP button that offers assistance and information for the corresponding page.

A tutorial is designed to guide a user through the download process.
http://seamless.usgs.gov/tutorial.php

Below Screen-grab shows the live interactive easy-to-use interface of USGS Global Seamless Map Server.

Africa Maps, Layers and data - Totally FREE !

Search, Download, discover and explore more than 50 maps layers and data of Africa free from this exclusive web portal.

View:
The View tab displays a base layer map (called Google Physical) when you first open AfricaMap. You can choose from several other base layers by clicking the "+" symbol at the upper right and selecting other maps.

You can zoom in and out on the map (change scales) by clicking on the '+' or '-' icons on the zoom bar to the left. You can also click on the zoom bar or drag the zoom bar to change scales. Alternatively you can use your mouse wheel if you have one. The most precise way to zoom is by holding the shift key down, then clicking on your mouse and holding while dragging to create a window. This approach let you go straight to the area you wish to zoom to.


You can search for specific places in Africa (towns, rivers, mountains, etc.) by name using the Text Search Box just below the tabs. Before you search for Places you will need to go into the Map Layers tab, open the Place Names category, and turn on the All Places layer for searching (second toggle). Then go back to the View tab and type in the location you wish to search for in the text box. Locations which match your search (or are close in spelling) are displayed on the map as red triangles. Any layer that has a toggle for searching can be searched via the text box.

If you want to clear the screen click Reset which is to the right of the Text Search Box Search button.

Two methods to save or share map views: (1) To the upper right is a Link-to-this-Map feature that allows you to create a bookmark or URL for any map view. You can email this URL to a colleage so they can see what you see, or you can save the URL as a bookmark. (2) To save an image to a document file we recommend using a free, downloadable screen capture utility called Jing: http://www.jingproject.com, which will allow you to precisely capture any part of your map view and save it to a file.


FREELY Downloadable Map Layers and geodata:
The Map Layers tab lets you turn on map layers that you will then explore in the View. The Map Layers tab also provides access to information about each layer. Open the category you wish to explore by clicking the ‘+’ symbol next the category name. For example click the ‘+’ next to Base Mapping to see all the base mapping layers.

A base mapping layer is a general purpose map displaying roads, political boundaries, towns, rivers and other essential features for orientation. In many African countries there is no detailed online base mapping available. AfricaMap is intended, in part, as a means of providing base mapping where available free of charge.
  • Add – Use the Add column to turn layers on and off for display in the View tab. Any layer turned on here also appears in the Active Layer List (accessible by clicking the '+' sign to the upper right of the map view. Once in the Active Layer List, each layer has a transparency slider bar to control transparency. The order in which you turn layers on determines what layers display on top of other layers. A layer turned on later will display on top of a layer turned on earlier.
  • Search – Turn Search on for a layer to enable both map-click and text searches. If Search is turned on for a layer and you click on the map, information will be returned for that layer which describes the location at which you clicked. In addition, when you use the text search you will be searching the data behind that layer and will display features matching your search on the map. Search is only available for some layers.
  • Name – The name of the map layer.
  • Description – The description of the map layer.
  • Date – The year of the data.
  • Source – The organization which created the data layer, except where paper maps are the source. In the case of paper maps, the organization which created the paper maps is provided as the source.
  • Scale – The published, or in some cases estimated, scale of the data.
  • Extent Description – Describes the extent of the layer.
  • Language – The language used.

You may also like:

FAIR USE NOTICE: This site contains copyrighted material the use of which has not always been specifically authorized by the copyright owner. We are making such material available in our efforts to advance understanding of environmental, political, human rights, economic, democracy, scientific, and social justice issues, sustainable development, environmental, community and worker health, democracy, public disclosure, corporate accountability, and social justice issues, etc. We have included the full text of the article rather than a simple link because we have found that links frequently go "bad" or change over time. We believe this constitutes a "fair use" of any such copyrighted material as provided for in section 107 of the US Copyright Law. In accordance with Title 17 U.S.C. Section 107, the material on this site is distributed without fee or payment of any kind to those who have expressed a prior interest in receiving the included information for research and educational purposes. If you wish to use copyrighted material from this site for purposes of your own that go beyond 'fair use', you must obtain permission from the copyright owner.